In the fast-paced world of Software as a Service (SaaS), understanding your market potential is crucial for success. Three key metrics that help businesses gauge their market opportunity are Total Addressable Market (TAM), Serviceable Addressable Market (SAM), and Serviceable Obtainable Market (SOM). This article will delve deep into these concepts, explain how they apply to the SaaS industry, and provide examples from some of the biggest players in the field.
Table of Contents
- Introduction to TAM, SAM, and SOM
- Total Addressable Market (TAM)
- Serviceable Addressable Market (SAM)
- Serviceable Obtainable Market (SOM)
- The TAM-SAM-SOM Funnel
- Calculating TAM, SAM, and SOM
- Examples from Major SaaS Companies
- Importance in SaaS Strategy and Planning
- Common Pitfalls and How to Avoid Them
- Conclusion
1. Introduction to TAM, SAM, and SOM
Before diving into the specifics of each metric, it’s essential to understand that TAM, SAM, and SOM represent a funnel-like approach to market sizing. Each subsequent metric narrows down the market scope, providing a more realistic view of the potential market a SaaS company can capture.
2. Total Addressable Market (TAM)
TAM represents the total market demand for a product or service. In the SaaS context, it’s the maximum amount of revenue a SaaS company could generate if it had 100% market share and no competitors.
Key Points:
- TAM includes all potential customers worldwide.
- It assumes no restrictions on production capacity.
- TAM is often used to attract investors by showcasing the massive potential of a market.
SaaS Perspective:
In SaaS, TAM often extends beyond traditional industry boundaries. For example, a project management SaaS tool might consider its TAM to include all businesses globally that could benefit from project management software, regardless of their current solutions or budget constraints.
3. Serviceable Addressable Market (SAM)
SAM is a subset of TAM that represents the portion of the market that can be served by a company’s products or services. It’s more focused and realistic than TAM.
Key Points:
- SAM considers geographical constraints, product-specific needs, and other limiting factors.
- It helps in understanding the realistic market potential for a specific product offering.
SaaS Perspective:
For a SaaS company, SAM might be limited by factors such as:
- Language support for the software
- Regulatory compliance in different countries
- Technical requirements (e.g., internet connectivity, device compatibility)
- Pricing strategy (e.g., focusing on enterprise clients vs. small businesses)
4. Serviceable Obtainable Market (SOM)
SOM is the portion of SAM that a company can realistically capture. It’s the most conservative and achievable estimate of the three metrics.
Key Points:
- SOM takes into account competition, sales and marketing capabilities, and other real-world constraints.
- It’s often expressed as a percentage of SAM.
SaaS Perspective:
In the SaaS world, SOM is influenced by factors such as:
- Brand recognition and reputation
- Feature set compared to competitors
- Customer acquisition costs
- Customer retention rates
- Sales and marketing budget
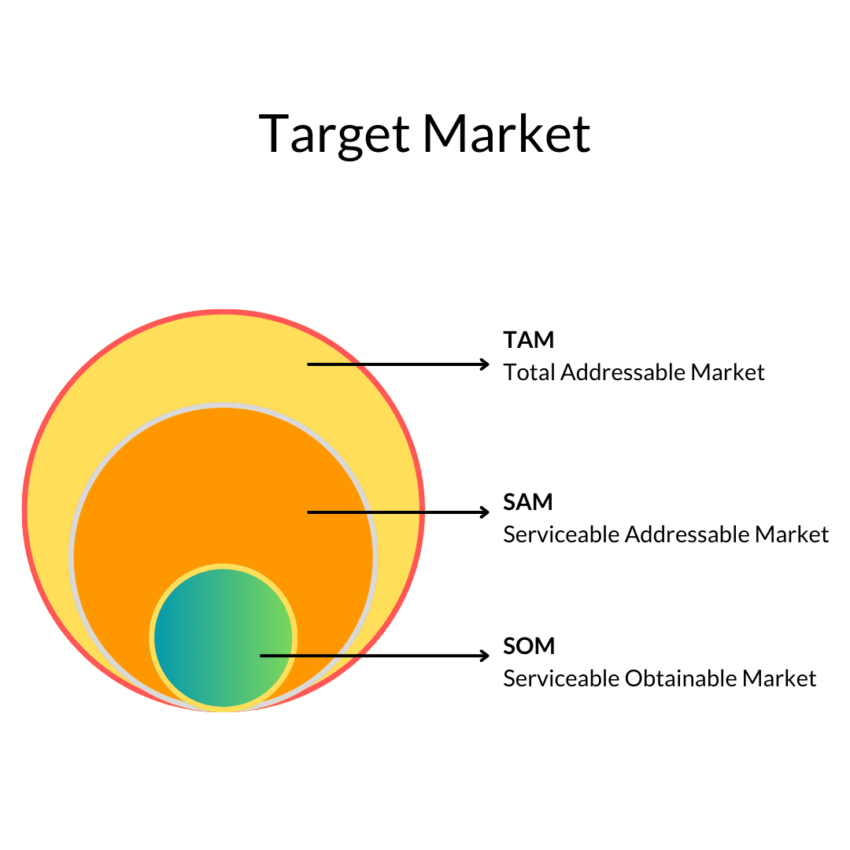
5. The TAM-SAM-SOM Funnel
Visualizing TAM, SAM, and SOM as a funnel helps understand their relationship:
   [TAM]
    \
     [SAM]
      \
       [SOM]
This funnel approach allows SaaS companies to set realistic goals and focus their resources effectively.
6. Calculating TAM, SAM, and SOM
TAM Calculation Methods:
- Top-down approach: Start with industry-wide data and narrow it down.
- Bottom-up approach: Start with your product’s price and multiply by the total number of potential customers.
- Value theory approach: Estimate how much value your product could provide to the entire market.
SAM Calculation:
SAM is typically calculated by segmenting TAM based on your specific offering, considering factors like geography, industry focus, or customer size.
SOM Calculation:
SOM is often estimated based on your company’s capabilities, resources, and competitive landscape. It’s usually expressed as a percentage of SAM that you can realistically capture in 3-5 years.
7. Examples from Major SaaS Companies
Let’s look at how some major SaaS companies might approach TAM, SAM, and SOM:
Salesforce (CRM)
- TAM: All businesses worldwide that could use CRM software.
- SAM: Businesses in countries where Salesforce operates, with compatible tech infrastructure.
- SOM: Portion of SAM that Salesforce can capture, considering competition from Microsoft Dynamics, HubSpot, etc.
Zoom (Video Conferencing)
- TAM: Global market for communication tools, including businesses, education, and personal use.
- SAM: Users with reliable internet connections in Zoom-supported countries.
- SOM: Market share Zoom can realistically capture, competing with Microsoft Teams, Google Meet, etc.
Shopify (E-commerce Platform)
- TAM: All businesses worldwide that could potentially sell products online.
- SAM: Businesses in Shopify-supported countries, focusing on small to medium-sized enterprises.
- SOM: Portion of SAM Shopify can capture, considering competition from WooCommerce, BigCommerce, etc.
8. Importance in SaaS Strategy and Planning
Understanding TAM, SAM, and SOM is crucial for SaaS companies because:
- Investment Decisions: It helps in attracting investors by showing market potential and realistic growth projections.
- Resource Allocation: Knowing your SOM helps in allocating resources effectively for product development and marketing.
- Product Roadmap: Understanding SAM can guide feature prioritization to address the needs of your serviceable market.
- Pricing Strategy: TAM and SAM insights can inform pricing decisions to maximize market penetration and revenue.
- Growth Planning: SOM helps set realistic growth targets and plan for scaling operations.
9. Common Pitfalls and How to Avoid Them
- Overestimating TAM: Be conservative and realistic in your estimates.
- Ignoring Market Dynamics: Consider how the market might change over time.
- Neglecting Competition: Always factor in existing and potential competitors when calculating SOM.
- Static Analysis: Regularly update your TAM, SAM, and SOM calculations as your business and the market evolve.
- Focusing Only on Numbers: Remember that quality of customers is as important as quantity.
10. Conclusion
TAM, SAM, and SOM are powerful tools for SaaS companies to understand their market potential and plan their growth strategies. By accurately assessing these metrics, SaaS businesses can make informed decisions about product development, marketing strategies, and resource allocation. Remember, the goal isn’t just to chase the largest market, but to find the right market where your SaaS solution can thrive and provide the most value to customers.
As the SaaS landscape continues to evolve, regular reassessment of these metrics will be crucial for staying competitive and identifying new opportunities for growth. By mastering the art of market sizing through TAM, SAM, and SOM, SaaS companies can position themselves for long-term success in this dynamic and exciting industry.